Your tests finished 10 minutes ago. You click into GitHub Actions, find the workflow run, expand the test step, scroll through 500 lines of output looking for the failure. By the time you find it, you’ve forgotten why you were looking. Sound familiar?
Where CI Test Results Hide
Every CI platform buries test results differently, but they all make you work for it:
- GitHub Actions - Workflow run → Job → Step → Expand logs → Scroll
- GitLab CI - Pipeline → Job → Scroll through output
- Jenkins - Build → Console Output → Search for “FAILED”
- CircleCI - Workflow → Job → Steps → Find the test step
Even when you find the results, you’re looking at raw terminal output. Pass counts mixed with stack traces mixed with timing info. Good luck sharing that with your PM.
The Real Pain Points
No Single View
Test results are scattered across CI runs, branches, and PRs. Want to know the overall health of your test suite? You’d need to manually check multiple workflow runs and piece it together.
Context Switching
Every failed test means: leave your IDE → open CI → find the right run → expand the right step → scroll to the failure. Multiply by 5 failures and 10 minutes are gone.
No Historical Context
Was this test flaky last week? Has the pass rate been declining? CI logs don’t tell you. Each run exists in isolation with no connection to the past.
Team Visibility
When QA asks “did the tests pass?” you have to go check. When the PM wants to see test coverage for a feature, you export a CSV. When a colleague debugs the same flaky test you fixed last month, there’s no shared knowledge.
What Teams Actually Need
A test results dashboard should answer these questions instantly:
| Question | Dashboard Answer |
|---|---|
| Did the tests pass? | Green checkmark or red X, visible in 2 seconds |
| Which tests failed? | Click to see the specific failures |
| Is this test flaky? | Historical pass rate shows the pattern |
| Is the suite healthy? | Trend line shows improvement or decline |
| Can I share this with QA? | Send a link, no CI access required |
CI Logs vs. Test Dashboard
| Aspect | CI Logs | Test Dashboard |
|---|---|---|
| Time to find failure | 2-5 minutes | 10 seconds |
| Historical data | None | Full run history |
| Shareable | Requires CI access | Simple link |
| Cross-framework view | Separate per tool | Unified |
| Flaky test detection | Manual observation | Automatic |
| Team access | Developer-only | Anyone with link |
How Gaffer Works as Your Test Dashboard
Gaffer collects test results from your CI pipeline and presents them in a clean, searchable dashboard.
Automatic Upload from CI
Add one step to your workflow. Results appear in the dashboard immediately.
GitHub Actions:
- name: Run tests  run: npm test
- name: Upload to Gaffer  if: always()  uses: gaffer-sh/gaffer-uploader@v2  with:    api-key: ${{ secrets.GAFFER_UPLOAD_TOKEN }}    report-path: ./test-results
GitLab CI:
test: script: - npm test after_script: - curl -X POST https://api.gaffer.sh/upload \ -H "X-API-Key: $GAFFER_UPLOAD_TOKEN" \ -F "files=@test-results/results.json"Dashboard Features
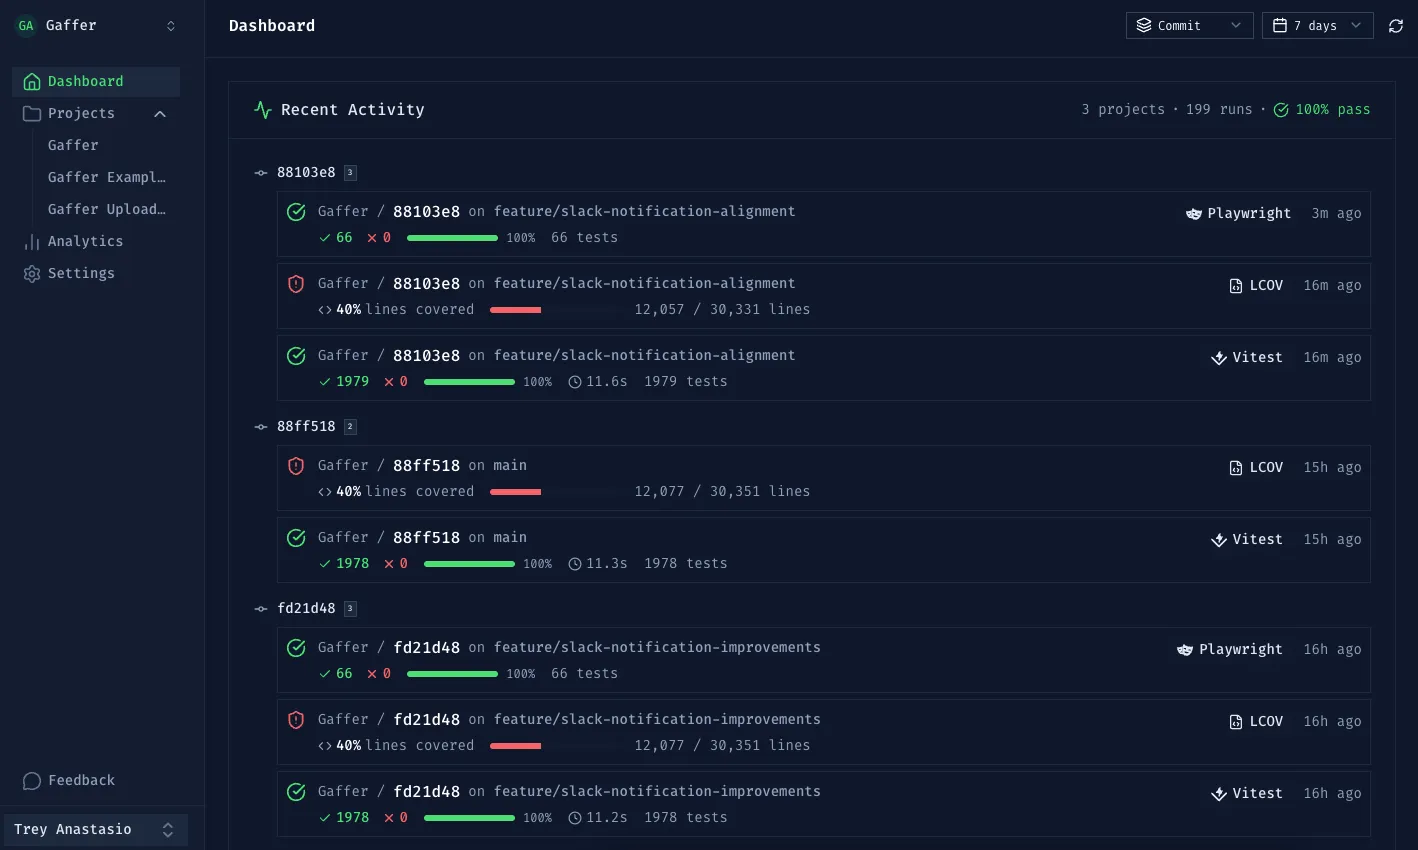
Project Overview
- Pass rate at a glance
- Recent test runs with status
- Trend over time
Test Run Details
- Every run listed with status, duration, commit SHA
- Filter by branch, date range, pass/fail
- Click into any run to see individual test results
Failure Investigation
- See exactly which tests failed
- Error messages and stack traces
- Link directly to the failing test
Works With Any Framework
Gaffer accepts results from:
- JavaScript/TypeScript: Jest, Vitest, Playwright, Cypress
- Python: pytest (with JUnit XML output)
- Java: JUnit, TestNG
- Any framework that outputs JUnit XML or JSON
Beyond Visibility: Analytics
Once you have historical test data, you unlock insights that CI logs can’t provide:
Flaky Test Detection
Gaffer tracks pass/fail rates across runs. Tests that fail intermittently (10-90% failure rate) are flagged as flaky. No more “I think that test is flaky” - you have data.
Duration Trends
Are your tests getting slower? The analytics dashboard shows duration trends so you can catch performance regressions early.
Filter and Search
Quickly find what you need:
- Filter by branch, commit, or date range
- See which tests fail most frequently
- Track test duration trends over time
Getting Started
Gaffer’s free tier includes 500 MB storage with 7-day retention - enough to try it on a real project. Paid plans offer up to 90-day retention and advanced analytics.